Dashboard
The dashboard answers “how is this project actually going?” without anyone assembling a report.
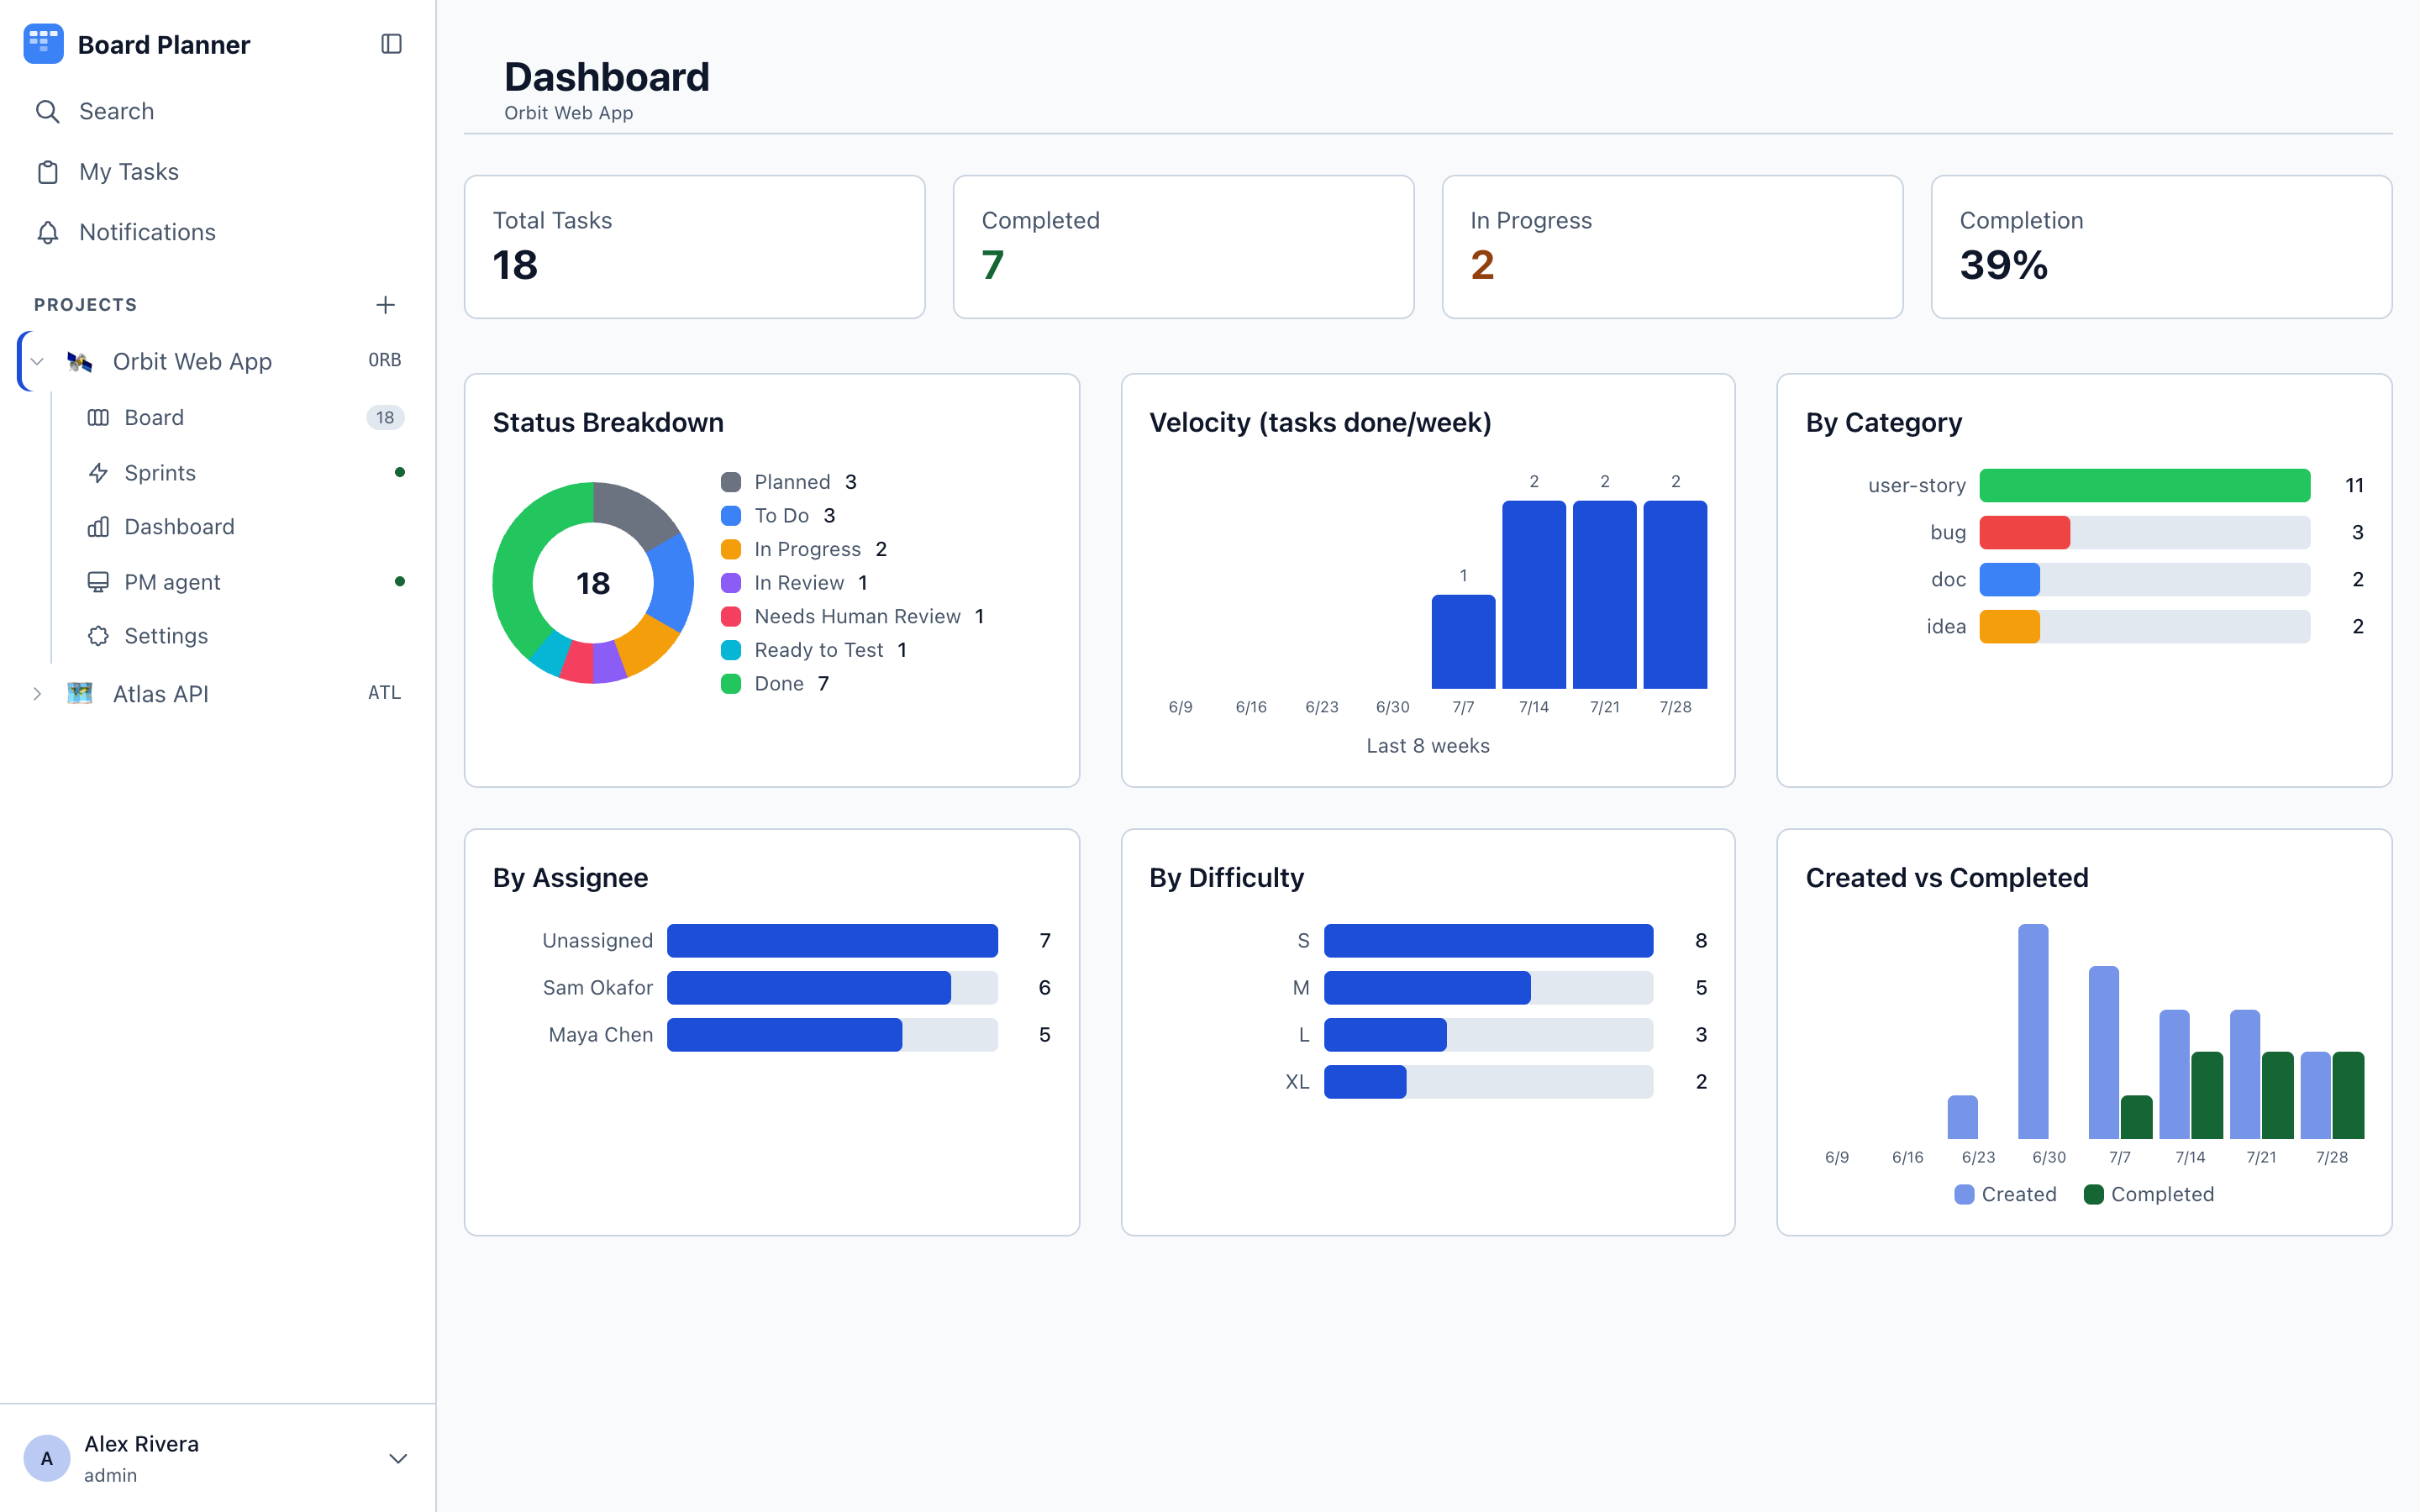
The numbers along the top
Section titled “The numbers along the top”Total tasks, Completed, In progress, and Completion as a percentage. Deliberately blunt.
In progress counts every column with the active role, so a board with two of them sums both. A board with none gets a dash and a banner saying why, rather than a zero: zero would be a claim about the tasks, when what is missing is a column role. You cannot put a board into that state today — Settings → Board refuses both removing the last active column and taking the role off it — so this is what a board that predates the rule looks like until somebody gives a column the role back.
The six panels
Section titled “The six panels”| Panel | What to look for |
|---|---|
| Status breakdown | A doughnut of every column the board defines, including ones you added. A bulge in a review column means work is finished but not accepted — the most expensive kind of queue. |
| Velocity | Tasks finished per week over the last eight weeks. Read the trend, not the number. |
| By category | The split between bug, doc, user-story and idea. A bug bar that keeps growing is a quality signal. |
| By assignee | Load per person, with unassigned work called out. |
| By difficulty | The S/M/L/XL spread, read from a project field named Difficulty. Create that field and the panel fills in; without it the panel explains itself and stays empty. It reads the field, never the old fixed column, so values recorded since it became an ordinary project field are the ones you see. |
| Created vs completed | Two series per week, over the same eight-week window. When created runs above completed for weeks, the backlog is growing whatever velocity says. |